


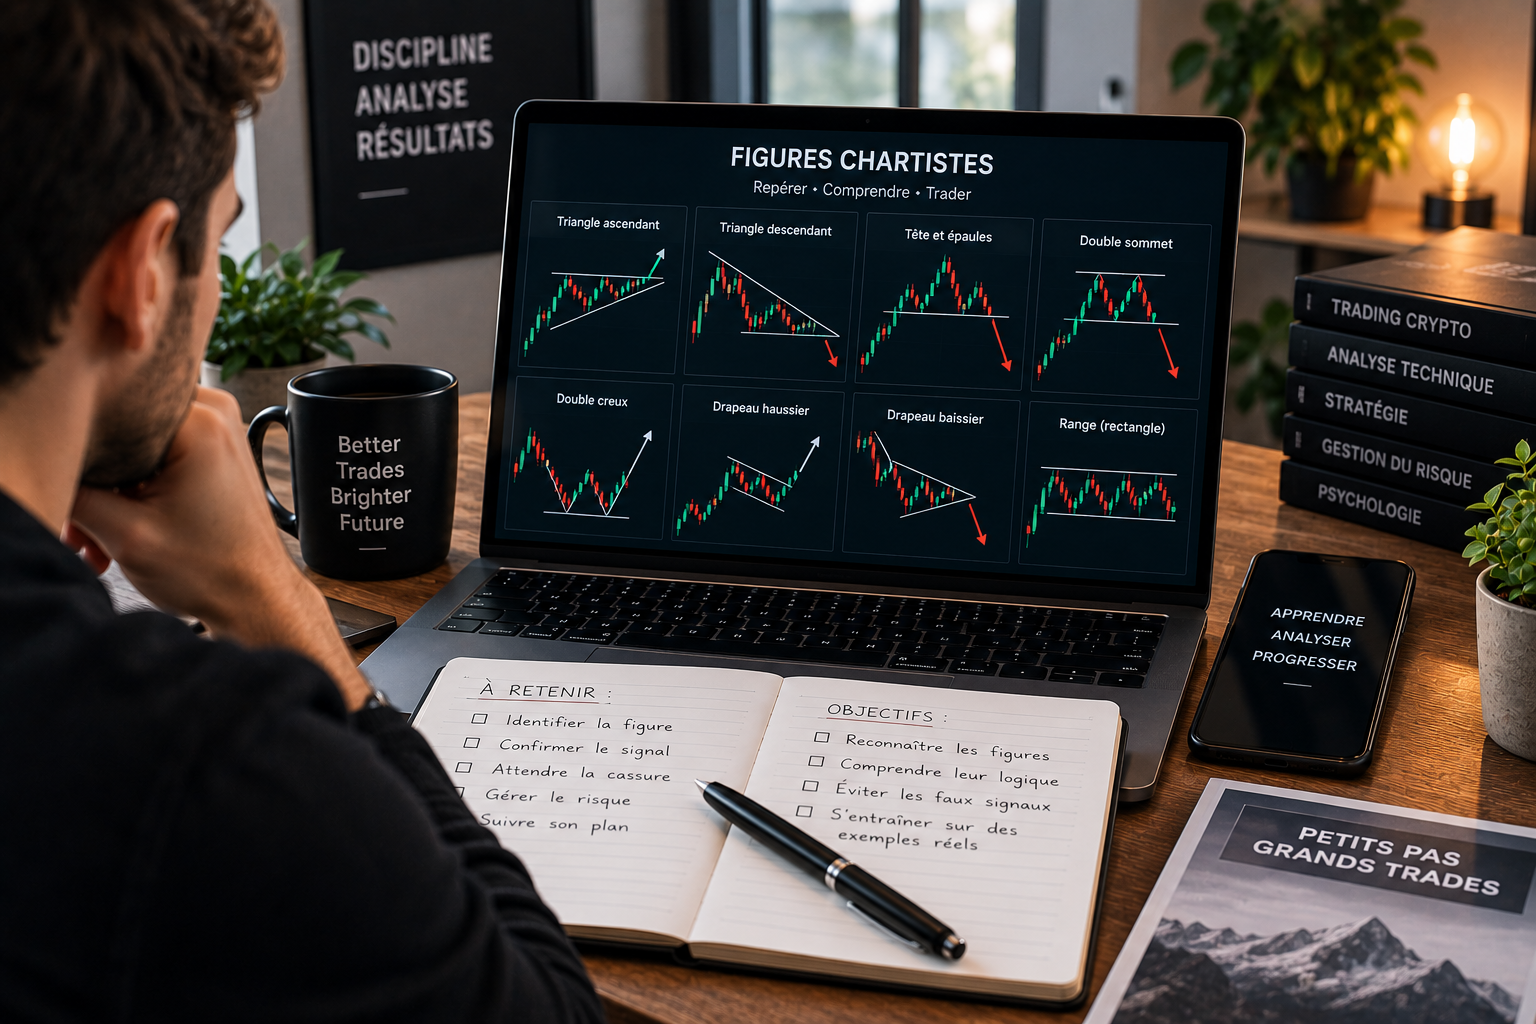
On a crypto chart, the price doesn’t move entirely at random. It regularly draws recurring shapes, called chart patterns. These formations, known for decades in technical analysis, reflect the balance of power between buyers and sellers and give clues about the likely direction of the price. Knowing how to recognize them perfectly complements reading candles and support and resistance levels. But you still need to use them correctly, because they also come with traps.
In this guide, we review the main chart patterns to know, what they mean, and how to use them without going wrong.
What is a chart pattern?
A chart pattern is a recognizable shape drawn by the price on the chart. It’s made up of a series of movements that, together, form an identifiable motif: a triangle, a head flanked by two shoulders, a rectangle, and so on.
These patterns have value because they reflect the collective psychology of the market. A triangle that narrows reflects growing hesitation, an accumulation of tension before a decision. A reversal pattern reflects an exhaustion of the ongoing trend. By learning to read them, you don’t guess the future, you interpret the behavior of market participants at a given moment.
There are two main families: continuation patterns, which suggest the ongoing trend will resume, and reversal patterns, which suggest a change in direction.
Continuation patterns
These patterns generally appear during a pause within a trend. They suggest the market is catching its breath before moving in the same direction again.
Triangles
The triangle is one of the most common patterns. It forms when the price oscillates in an increasingly narrow zone, with the highs and lows gradually converging. This compression reflects a tension that eventually releases through a breakout, often in the direction of the previous trend. There are ascending triangles (rather bullish), descending ones (rather bearish) and symmetrical ones (direction to be confirmed by the breakout).
Flags
The flag forms after a strong, fast move. The price pauses, moving in a small channel tilted against the move, before resuming in the initial direction. It’s a classic continuation pattern, reflecting a simple breather in the market before the trend resumes.
Rectangles
The rectangle appears when the price oscillates horizontally between a clearly defined support and resistance for a certain time. This consolidation phase generally resolves through a breakout of one of the two edges, often in the direction of the prior trend.
Reversal patterns
These patterns signal a possible exhaustion of the ongoing trend and an upcoming change in direction.
Head and shoulders
The head and shoulders pattern is one of the most famous and most reliable. It’s made up of three peaks: a higher central peak (the head) flanked by two lower peaks of similar height (the shoulders). A line, called the neckline, connects the troughs between these peaks. When the price breaks this neckline downward, the pattern signals a bearish reversal. There’s also an inverted version, signaling a bullish reversal.
Double top and double bottom
The double top forms when the price reaches the same high level twice without managing to break above it, drawing an M shape. It’s a bearish reversal signal: buyers failed twice, sellers take over. The double bottom is its mirror, in a W shape, and signals a bullish reversal after two tests of the same low level.
How to use chart patterns without going wrong
Chart patterns are useful, but they aren’t guarantees. Here are the principles for using them correctly.
First, wait for confirmation. A pattern is only valid when it’s completed by a clean break of the key level (the neckline of a head and shoulders, an edge of a triangle). Anticipating a pattern before its confirmation means exposing yourself to false signals. A candle close beyond the level, on a significant timeframe, is better than a mere momentary overshoot.
Next, beware of subjectivity. The human brain tends to see patterns everywhere, even where there are none. A pattern only has value if it’s clean and obvious. If you have to squint to make it out, it probably doesn’t exist.
Finally, always place the pattern in its context. A reversal pattern at the top of a long trend, on a major resistance level, carries far more weight than an isolated pattern. And as always, consistency across several timeframes considerably strengthens the reliability of the signal.
The stop loss remains essential
Even the finest chart pattern can fail. A perfectly drawn head and shoulders can produce a false signal, with the price moving the other way. This is why a pattern should never be traded without a stop loss. The pattern gives you a likely scenario and a logical level to place your stop (for example beyond the neckline or the last peak), but it never replaces risk management.
How SumoAnalysis leverages patterns
Recognizing chart patterns objectively, without the bias of subjectivity, and checking their validity in real time across several cryptos and several timeframes requires a lot of experience. This is what SumoAnalysis automates. The AI-powered crypto technical analysis identifies chart configurations and market structure without the emotion or biases that fool the human eye.
Each detected pattern is verified across several timeframes thanks to multi-timeframe analysis, which filters out false formations. And when a configuration is validated, the crypto signal provides a complete plan with entry, stop and targets, calibrated by TP/SL optimization. You go from recognizing a pattern to an actionable trading plan, without the risk of seeing patterns that don’t exist.
Summary
- A chart pattern is a recognizable shape drawn by the price, reflecting market psychology
- Continuation patterns: triangles, flags and rectangles, which suggest the trend will resume
- Reversal patterns: head and shoulders, double top and double bottom, which signal a change in direction
- Always wait for confirmation by a clean break before validating a pattern
- Beware of subjectivity: a pattern only has value if it’s clean and obvious
- Place the pattern in its context and check consistency across timeframes
- A pattern is never traded without a stop loss, because even the best ones can fail
👉 Try SumoAnalysis free for 7 days and let the AI detect reliable chart patterns for you, without bias or subjectivity.
Disclaimer: This article is for educational purposes and does not constitute investment advice. Cryptocurrency trading carries a risk of capital loss. Only trade with capital you can afford to lose.