


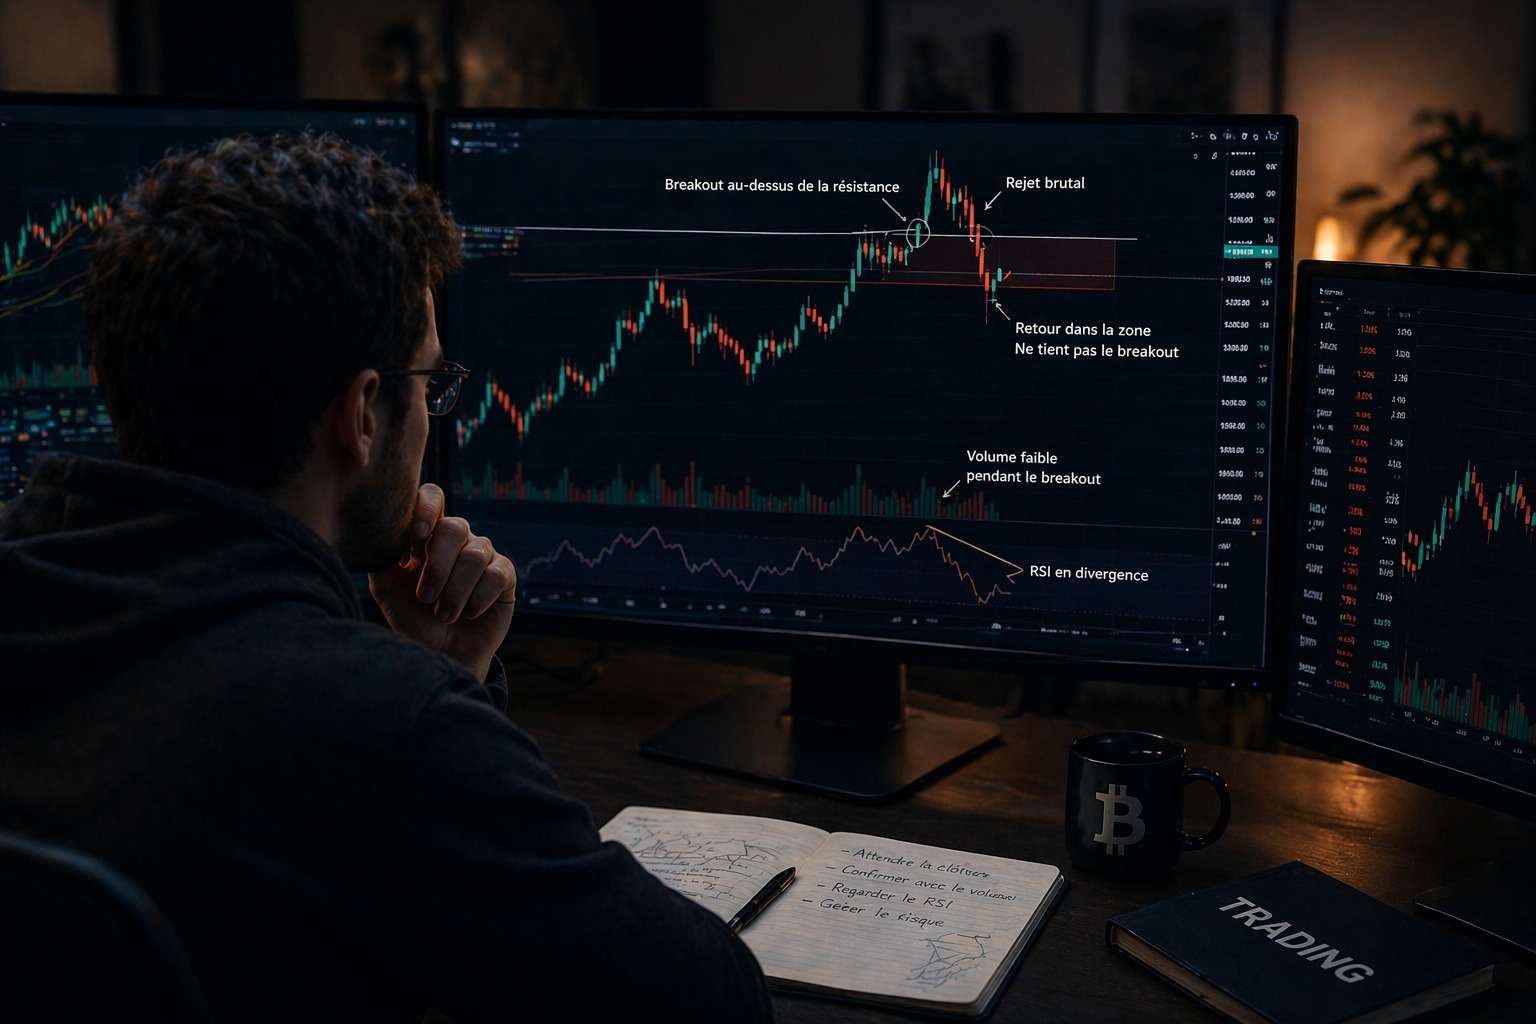
A fake breakout in crypto occurs when the price breaks through a key level (support or resistance) and then immediately reverses, trapping traders who entered on the breakout. This is one of the most common and costly situations for beginner traders. According to observations by experienced traders, approximately 60 to 70% of initial breakouts on small timeframes are false signals.
In this article, we’ll break down the 5 criteria that help distinguish a real breakout from a fake one, with concrete examples and practical solutions to avoid falling into this trap.
Why False Breakouts Are So Common in Crypto
Organized Stop Hunts
Major market players (market makers, institutions) know exactly where retail traders’ stops are placed: just below obvious support levels and just above obvious resistance levels. They deliberately push the price beyond these levels to trigger stops, absorb liquidity, and then let the price return to its original direction.
This phenomenon isn’t a conspiracy theory—it’s documented and visible on all charts. The long wicks that extend beyond an obvious support level and then pull back are the hallmark of these stop hunts.
The psychology of FOMO
When a major resistance level is broken, traders rush to buy out of fear of missing out (FOMO). This wave of buying pushes the price up by a few percent, but without real conviction. When real buyers don’t follow through, the price falls back and traps everyone who entered out of FOMO.
The 5 Criteria for Identifying a True Breakout
Criterion 1: Volume Explodes on the Breakout
This is the number one and most reliable criterion. A true breakout is accompanied by a surge in volume—the breakout candle must have a volume 2 to 3 times higher than the average of the previous candles.
Why? Because a true breakout mobilizes many buyers (or sellers) who enter the market in force at the breakout. If volume is low, it means few traders are truly convinced, and the breakout will likely not hold.
On your chart, display the volume histogram at the bottom of the screen and visually compare the size of the breakout candle’s volume bar to the previous 20 candles.
Criterion 2: The candle closes above the level
Never consider a breakout valid until the candle has closed above the level. A wick that temporarily extends beyond the resistance during the candle doesn’t count—only the final close matters.
Even better: wait for 2 or 3 consecutive candles to close above the level for true confirmation. Yes, you’ll enter a little later and capture a little less of the move, but you’ll eliminate the vast majority of false signals.
Criterion 3: The wick is short, the body is large
A true breakout candle has a massive body (the price has risen decisively) and short wicks (little hesitation). Conversely, a candle with a long upper wick that closes near its opening level is a sign of rejection—sellers have regained control and the breakout will fail.
These rejection candles (pin bars, shooting stars) are major red flags. If you see them on a “breakout,” do not take the trade under any circumstances.
Criterion 4: Retesting the broken level
After a true breakout, the price often returns to test the broken level before continuing in the direction of the breakout. This retest is THE best time to enter, as it offers an excellent risk-reward ratio with a tight stop.
Concrete example: A resistance level at $3,200 on ETH is broken with volume. The price rises to $3,280 then pulls back to $3,210 (just above the former resistance that has now become support). This is your entry signal. Your stop can be placed at $3,150 ($60 away) with a target of $3,400 ($190 away), for a 1:3 risk-reward ratio.
If the price breaks a level and then falls BELOW that level during the retest, it’s confirmed: it was a false breakout. Do not enter under any circumstances.
Criterion 5: Multi-timeframe consistency
A breakout on the 15-minute chart that goes against the trend on the 4-hour and daily charts is extremely suspicious. Breakouts that occur in the direction of the trend on higher timeframes are much more likely to be genuine.
Before trading a breakout, ask yourself: is this breakout aligned with the direction of the 4H and 1D charts? If yes, the probability increases. If not, exercise extreme caution. This logic is at the heart of multi-timeframe analysis.
The Most Tricky Setups
Breakouts at the End of the Asian Session
Asian sessions (from 10 PM to 8 AM French time) are often periods of low volume and manipulation. Breakouts that occur during these hours are frequently reversed at the opening of the European or American session. If you see a breakout during the European night, wait for the European open for confirmation.
The news-driven breakout
When major news breaks (a Fed decision, regulatory announcement, Elon Musk tweet), the price can make an extreme move of 5 to 10% in just a few minutes. These moves are often followed by sharp corrections once the excitement dies down. Do not trade news-driven breakouts in the first hour—wait for volatility to subside.
Breakout from a long consolidation range
The longer a range has lasted, the more likely the initial breakout is to be a false one. Paradoxically, the first breakouts from these ranges are often traps because too many traders anticipate the direction. The real breakout often comes after a false breakout in the opposite direction that has swept out the stops.
What to do when you’ve been trapped by a false breakout
Even when applying the 5 criteria, you will sometimes fall for a false breakout. It’s inevitable. The difference between a profitable trader and a losing trader is how they handle these situations:
- Stick to your stop loss. Don’t try to “give the trade a chance” by moving the stop. That’s how a small loss turns into a big loss.
- Don’t make a revenge trade. If you’ve just lost on a false breakout, don’t immediately enter another trade to “make it back.” You’re emotionally compromised.
- Analyze what went wrong. Was the volume actually above average? Did the candle have a suspicious wick? Was the trade going against the higher timeframe?
The “false breakout trade” technique
Advanced traders even know how to profit from false breakouts by taking the opposite trade. When they identify a false breakout (low volume, long wick, return below the broken level), they take a position in the opposite direction of the breakout.
This is an advanced strategy that requires experience, but it allows you to turn a situation that traps the majority into an opportunity. A false breakout above resistance becomes a sell signal; a false breakout below support becomes a buy signal.
How SumoAnalysis filters out false breakouts
Detecting true breakouts requires simultaneously checking volume, candle structure, retests, and multi-timeframe consistency. This is exactly the type of task that automated crypto technical analysis excels at.
SumoAnalysis’s AI engines verify these criteria for every signal generated, filtering out the vast majority of false breakouts that trap manual traders. Crypto signals with a high confidence score are those where the breakout is validated based on multiple objective criteria.
In summary
- Most initial breakouts on small timeframes are false signals
- A true breakout is accompanied by volume 2-3x higher than average
- Never enter on a wick — wait for the candle to close beyond the level
- The retest of the broken level is the best time to enter with a tight stop
- A breakout against the trend of higher timeframes is suspicious
- Be wary of breakouts during the Asian session and on news
- When you’re trapped, stick to your stop and don’t make a revenge trade
👉 Try SumoAnalysis free for 7 days and receive signals where false breakouts are filtered out by AI multi-timeframe analysis.
—————————————————————————————
Disclaimer: Even the best techniques do not guarantee 100% success. Always trade with a stop loss and strict risk management.