


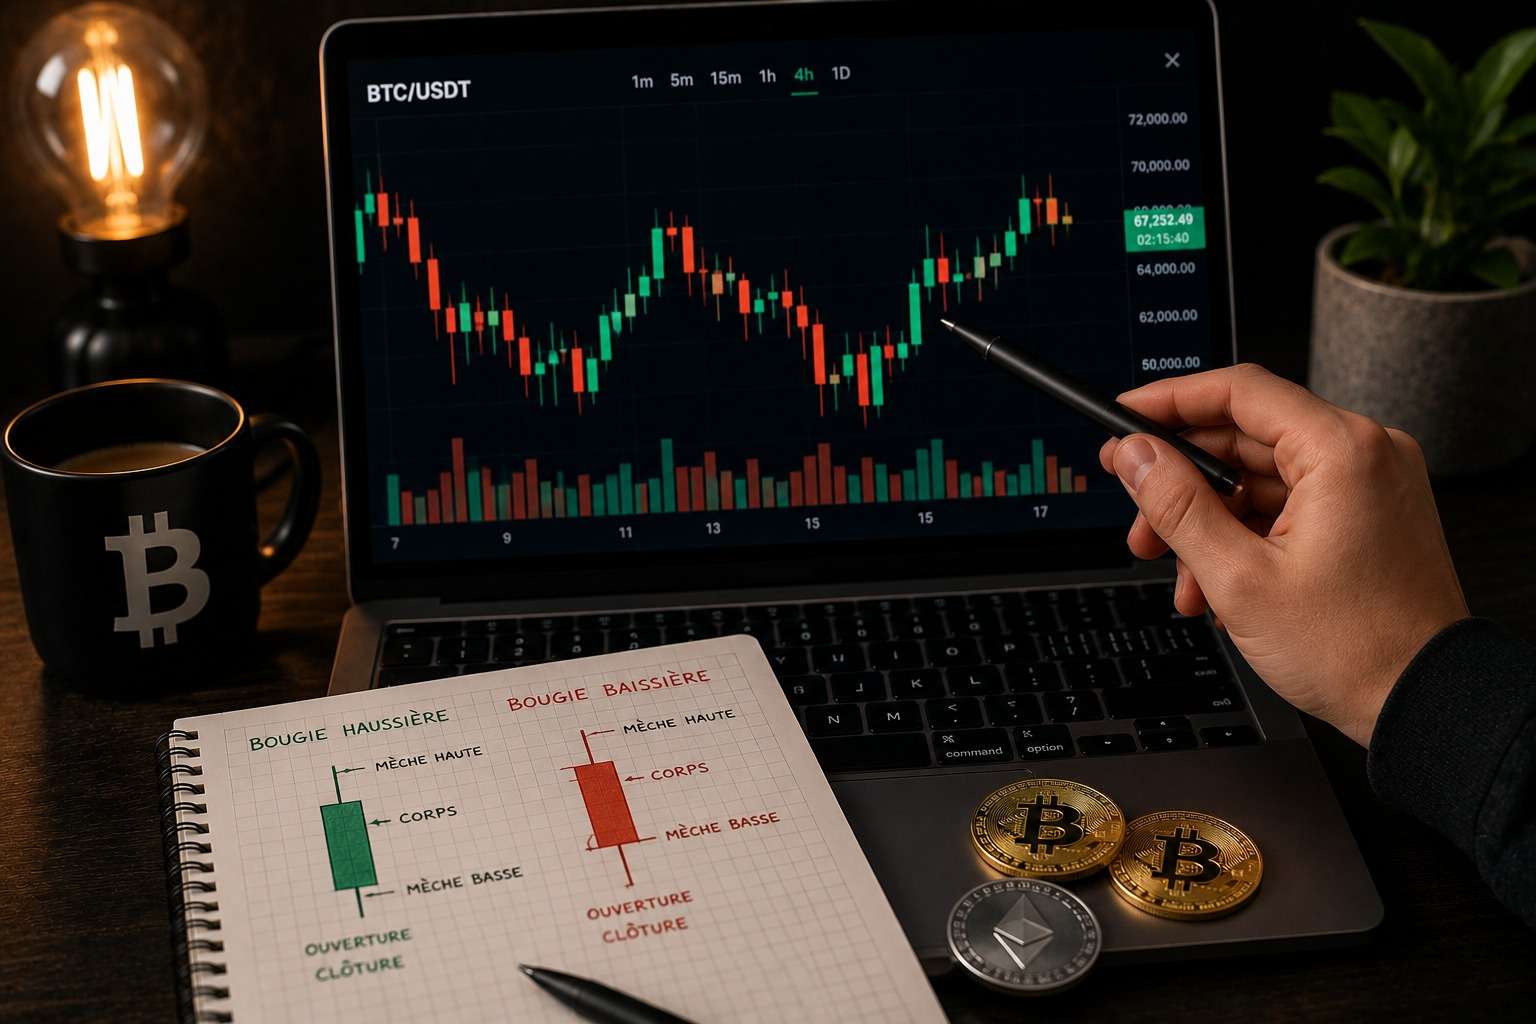
When you open a crypto chart for the first time, you’re met with a forest of small red and green rectangles topped with thin lines. These are Japanese candlesticks, and they make up the basic language of technical analysis. Knowing how to read them is like learning the alphabet before writing: essential for understanding what a chart is really telling you. The good news is that the principle is simple once you grasp the logic.
In this guide, we explain how a candlestick is built, how to interpret it, and which essential patterns to know when starting out.
What is a Japanese candlestick?
A Japanese candlestick (or candle) is a visual representation of an asset’s price movement over a given period. Each candle summarizes four essential pieces of information for that period: the opening price, the closing price, the highest price and the lowest price.
The period represented depends on the timeframe you’re viewing. On a 1-hour chart, each candle summarizes one hour of trading. On a daily chart, each candle summarizes an entire day. This is what makes candles so practical: at a glance, you see everything that happened during the period.
The anatomy of a candle: body and wicks
A Japanese candlestick has two parts: the body and the wicks (also called shadows). Understanding these two elements is enough to read any chart.
The body
The body is the central rectangle, the thickest part of the candle. It represents the gap between the opening price and the closing price of the period. A large body indicates a significant price movement in one direction; a small body indicates that the price barely moved between the open and the close.
The wicks
The wicks are the thin lines extending above and below the body. The upper wick shows the highest price reached during the period, the lower wick shows the lowest price. The wicks tell the story of the battle that took place: a long upper wick means the price rose sharply before falling back, a long lower wick means it dropped before recovering.
Bullish or bearish candle: the color
The color of the candle immediately tells you who won the battle during the period, the buyers or the sellers.
A bullish candle (usually green or white) means the price closed higher than it opened. Buyers dominated. On this type of candle, the bottom of the body is the open and the top of the body is the close.
A bearish candle (usually red or black) means the price closed lower than it opened. Sellers dominated. On this type of candle, it’s the reverse: the top of the body is the open and the bottom of the body is the close.
This simple color code lets you, by scanning a chart, immediately see the phases of rise and fall.
What the shape of a candle tells you
Beyond color, the shape of the candle gives valuable clues about the balance of power in the market. Here are the basic configurations to recognize.
A candle with a large body and small wicks reflects clear domination by one side. If it’s green, buyers took control with force; if it’s red, it’s the sellers. It’s a sign of conviction.
A candle with a small body and long wicks on both sides reflects indecision instead. The price moved a lot in both directions but ended near its starting point. Neither buyers nor sellers managed to prevail.
A candle with a long wick on one side only is particularly interesting. A long lower wick indicates that sellers pushed the price down, but buyers regained the upper hand before the close. This is often a sign of rejection of a low level, potentially signaling a rebound.
The essential candlestick patterns to know
Some candles or combinations of candles have names because they appear often and give useful signals. Here are the main ones for beginners.
The Doji
The Doji is a candle whose open and close are at almost the same level, giving a tiny or even nonexistent body, often shaped like a cross. It reflects total market indecision and frequently appears before a change in direction. It’s not a signal in itself, but a warning to watch.
The Hammer
The Hammer is a candle with a small body at the top and a long lower wick. It appears after a decline and signals that buyers pushed the price back up. It’s a pattern often interpreted as a possible bullish reversal.
The Shooting Star
The Shooting Star is the opposite of the Hammer: a small body at the bottom and a long upper wick. It appears after a rise and signals that sellers pushed the price back down. It’s a pattern often interpreted as a possible bearish reversal.
The Engulfing
The Engulfing is a combination of two candles where the second entirely covers the body of the first. A bullish engulfing (a large green candle that swallows a red candle) suggests buyers taking control. A bearish engulfing suggests the opposite.
The limits to keep in mind
Japanese candlesticks are a powerful tool, but they’re not a crystal ball. A single candle, or even a recognized pattern, is never enough on its own to make a reliable trading decision.
A reversal pattern only has value when placed in its context: the overall trend, nearby support and resistance levels, volume, and above all consistency with the other timeframes. A Hammer appearing on a major support, in agreement with the higher timeframe’s trend, carries far more weight than an isolated Hammer in the middle of nowhere. This is why experienced traders always cross-check several signals before acting.
From candles to a trading decision
Reading candles is the first building block of technical analysis, but correctly interpreting their context takes experience and time. This is precisely the work that SumoAnalysis automates. The AI-powered crypto technical analysis continuously reads candlestick configurations, patterns and market structure to identify high-probability opportunities.
Above all, each configuration is verified across several timeframes thanks to multi-timeframe analysis, which avoids the trap of the isolated signal. And when an opportunity is validated, the crypto signal directly provides a complete plan with entry, stop loss and targets, thanks to TP/SL optimization. You go from reading candles to an actionable trading plan.
Summary
- A Japanese candlestick summarizes four pieces of information: open, close, high and low of a period
- It consists of a body (open/close gap) and wicks (price extremes)
- Green candle: buyers dominated. Red candle: sellers dominated
- The shape reveals the balance of power: large body for conviction, long wicks for indecision or rejection
- Essential patterns: Doji (indecision), Hammer (bullish reversal), Shooting Star (bearish reversal), Engulfing
- A single candle is never enough: context and multi-timeframe consistency are essential
👉 Try SumoAnalysis free for 7 days and let the AI read candlestick configurations for you, with ready-to-use signals.
Disclaimer: This article is for educational purposes and does not constitute investment advice. Cryptocurrency trading carries a risk of capital loss. Only trade with capital you can afford to lose.