


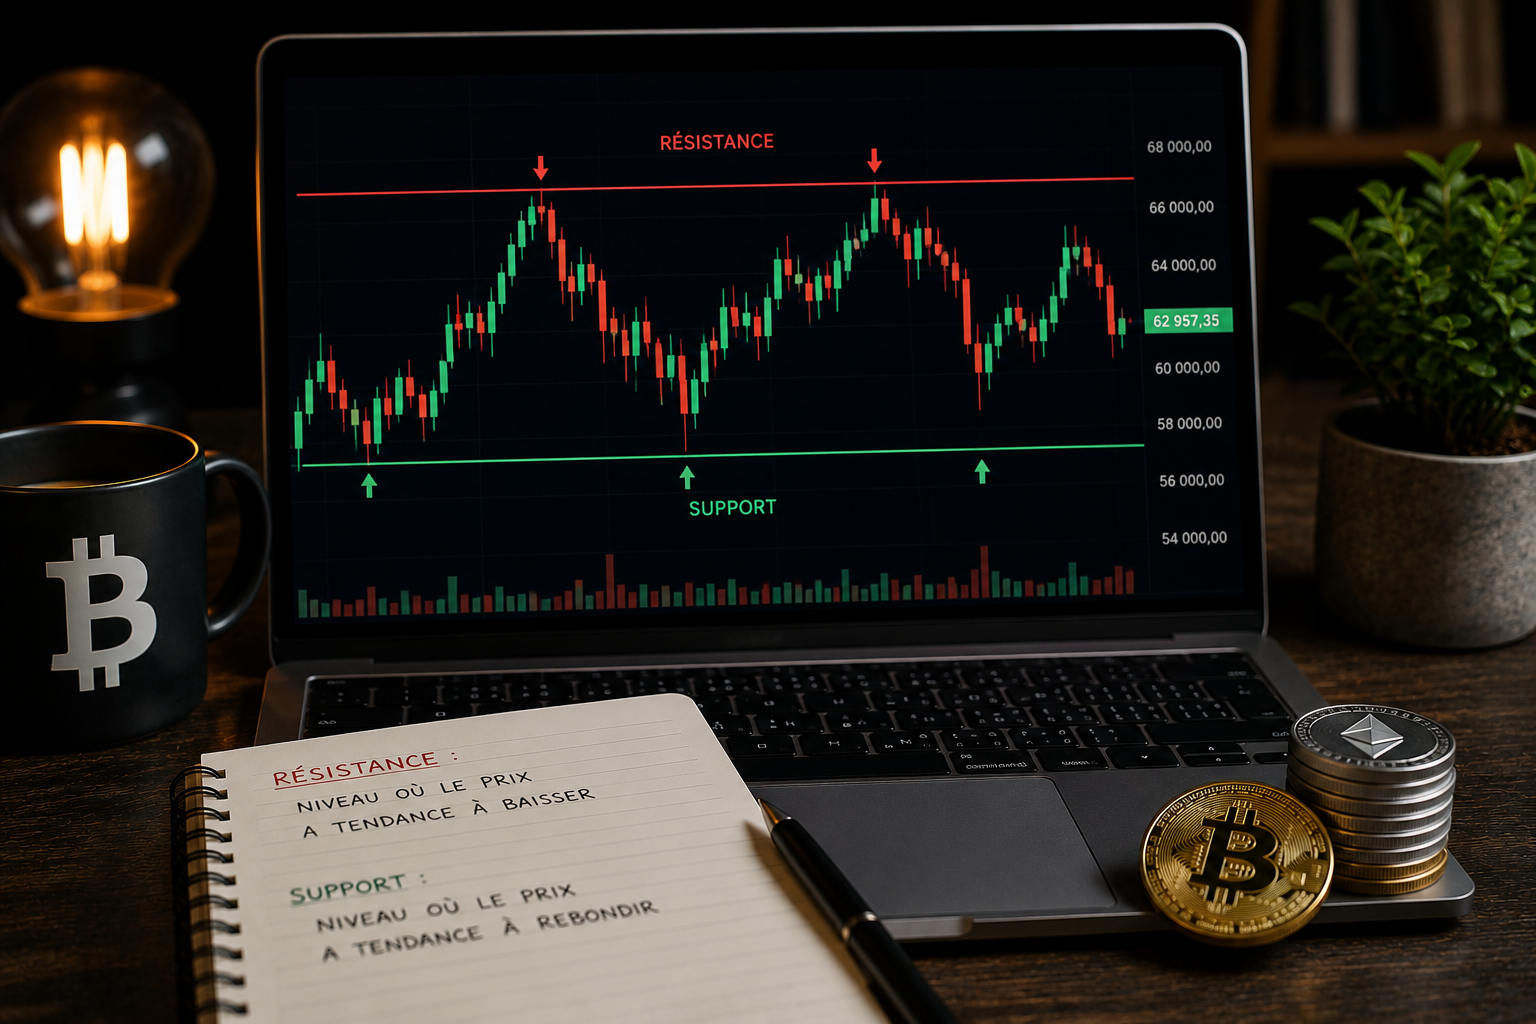
If you had to learn just one concept in technical analysis, this would be it. Support and resistance levels are the foundation of reading a crypto chart. They show you where the price is likely to pause, bounce, or accelerate, and serve as reference points for placing your entry orders, stop-loss orders, and profit targets. Once you know how to identify them, a chart ceases to be a series of random movements and becomes a clear roadmap.
In this guide, we explain what support and resistance are, how to draw them, and how to use them in your actual trading.
What Are Support and Resistance?
Support is a price level below which the price struggles to fall. It’s an area where buyers tend to regain control, halting the decline and often causing the price to bounce back up. You can think of it as a floor.
Resistance is the opposite: a price level above which the price struggles to rise. It’s an area where sellers regain the upper hand, halting the rise and often causing the price to fall back down. You can think of it as a ceiling.
These levels exist because the market has a memory. At certain prices, a large number of traders have made decisions in the past (buying, selling, placing orders), and these prices become battlegrounds again every time the market returns to them.
Why Support and Resistance Levels Work
These levels aren’t magical; they reflect the collective psychology of market participants. Understanding this logic helps you use them more effectively.
Imagine a price that bounces off the same low level several times. Traders watch this level, remember that it held, and place their buy orders just above it the next time the price approaches it. This collective behavior reinforces the support level: it holds because everyone expects it to hold. It’s a self-fulfilling prophecy.
The same mechanism applies to resistance levels. A level that has blocked the price multiple times becomes a point where sellers anticipate a block and place their sell orders, which effectively reinforces the resistance.
How to Draw Support and Resistance Levels
Identifying these levels is simpler than it seems. Here are the basic methods to get started.
Identify reversal points
The simplest method is to identify the points where the price has reversed multiple times. Look for lows where the price has bounced back up (support levels) and highs where it has been pushed back down (resistance levels). The more times a level has caused a reversal, the more significant it is.
Focus on zones rather than exact lines
A common mistake beginners make is looking for an exact price down to the cent. In reality, support and resistance are zones, not precise lines. The price may briefly break through a level and then pull back, this is normal. Think in terms of price ranges rather than single values.
Consider the importance of levels
Not all levels are equal. A level that has held on a daily or weekly chart is much stronger than one visible only on a 5-minute chart. Levels visible on longer time frames carry more weight and deserve greater attention.
The principle of polarity: when support becomes resistance
Here’s an essential concept that many beginners overlook. When support is decisively broken, it tends to turn into resistance. Conversely, when resistance is broken, it often becomes new support.
The logic is simple. A former support level that gives way becomes a resistance level, because traders who bought at that level and are now sitting on a loss will look to sell as soon as the price returns there, creating selling pressure. This principle of polarity is extremely useful for anticipating price behavior after a breakout.
How to Use Support and Resistance in Your Trading
Beyond theory, these levels have very practical applications in setting up a trade.
For your entry points, a support level is a potential buying zone (the price is likely to bounce off it), while a resistance level is a potential selling or profit-taking zone. Buying near a solid support level offers a better risk-reward ratio than buying in the middle of nowhere.
For your stop-loss orders, these levels serve as natural reference points. Placing a stop just below support (for a buy) makes sense: if support gives way, your trade idea is invalidated and it’s better to exit. This is more logical than a stop placed at an arbitrary percentage.
For your profit targets, the next resistance level is a logical target for taking profits. You know the price is likely to run into resistance there, so you might as well lock in your gains beforehand.
Pitfalls to Avoid
Support and resistance levels are powerful, but they come with a few classic pitfalls.
The first is the false breakout: the price briefly crosses a level to trap traders, before reversing direction. A breakout is only reliable if it is confirmed—ideally by volume and a clear close above the level.
The second pitfall is trading an isolated level without considering the broader context. Support is only meaningful when viewed within the overall trend and verified across multiple time frames. Support on the 15-minute chart carries little weight if it runs counter to the trend on the daily chart.
From Levels to Trading Decisions
Manually identifying relevant support and resistance levels, cross-referencing them with the trend, and verifying their strength across multiple time frames requires experience. This is exactly the task that SumoAnalysis automates. AI-powered crypto technical analysis continuously identifies key levels and market structure to pinpoint high-probability setups.
Thanks to multi-timeframe analysis, each level is evaluated across multiple timeframes, avoiding the trap of isolated support. And when an opportunity arises near a solid level, the crypto signal provides a comprehensive plan with entry, stop-loss, and take-profit levels calibrated using TP/SL optimization. Support and resistance levels thus move from theory to an actionable plan.
In summary
- Support is a floor below which the price struggles to fall; resistance is a ceiling above which it struggles to rise
- These levels function due to the collective psychology of traders (self-fulfilling prophecy)
- To identify them: look for reversal points, think in terms of zones, and prioritize longer time frames
- Principle of polarity: a broken support level becomes resistance, and vice versa
- Usage: enter near support levels, place stops below support levels, set targets at resistance levels
- Pitfalls to avoid: false breakouts and isolated levels taken out of context
👉 Try SumoAnalysis free for 7 days and let the AI identify key support and resistance levels for you, with ready-to-use signals.
Disclaimer: This article is for educational purposes only and does not constitute investment advice. Cryptocurrency trading involves the risk of capital loss. Only trade with capital you can afford to lose.